
With the right tools, you can tell whether the timing is good to buy,
and be alerted to pinpoint buying opportunities
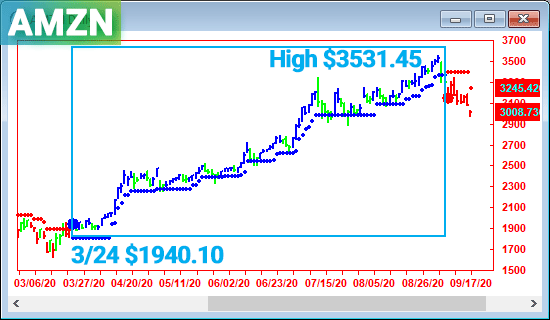
We often hear concern about missing a buying opportunity and having to buy at a higher price. In this section, we aim to show you that within a trend, multiple timing windows can exist for entry, reentry, or adding to a position.
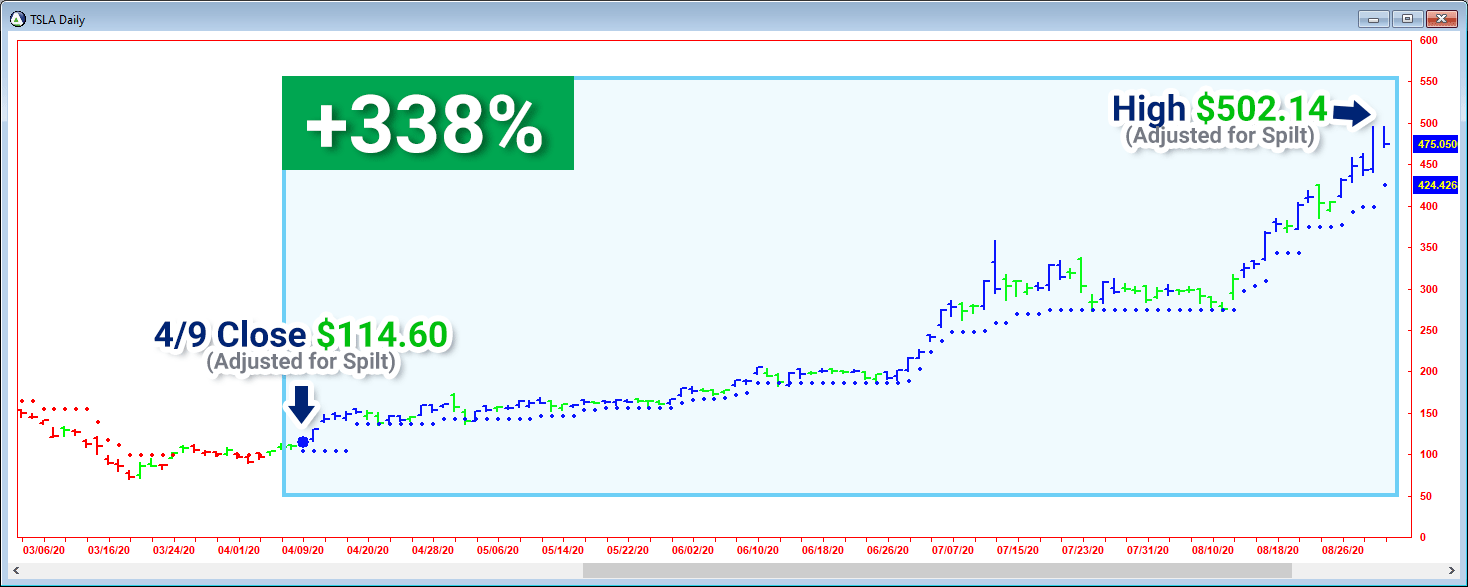
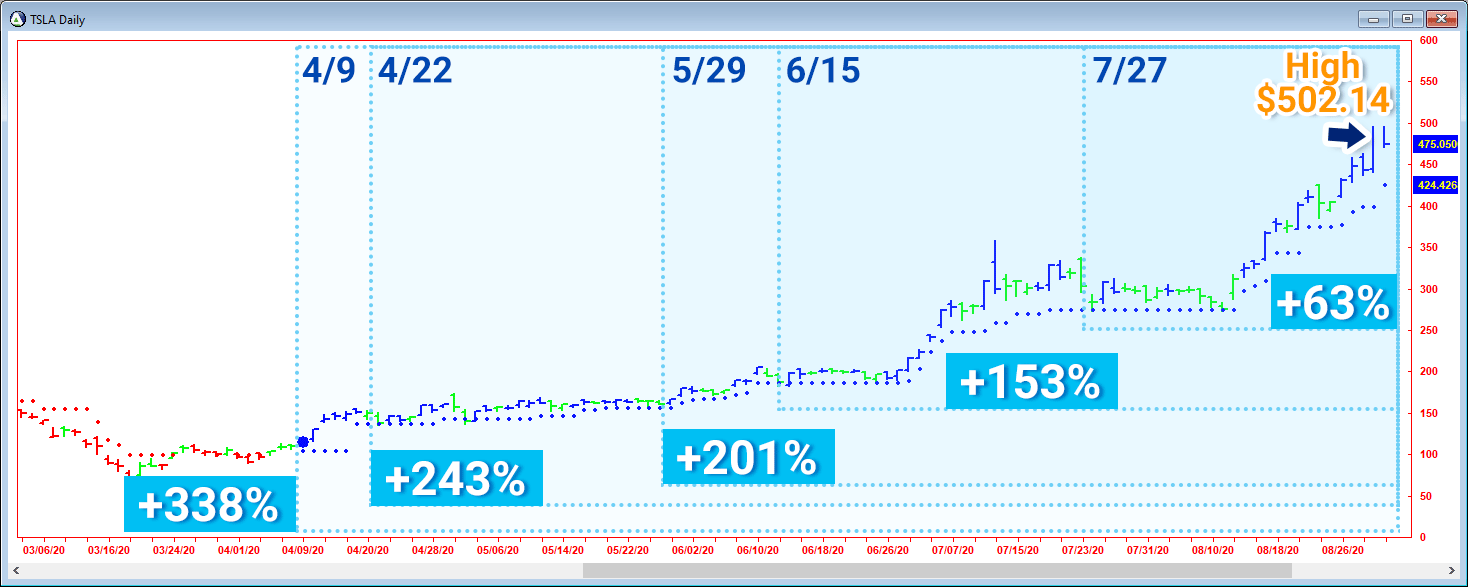
Beside the first blue signal, we also have Sweet Spots, which are also great times to get in. The following charts will highlight the Sweet Spots that we can see in this TSLA example.
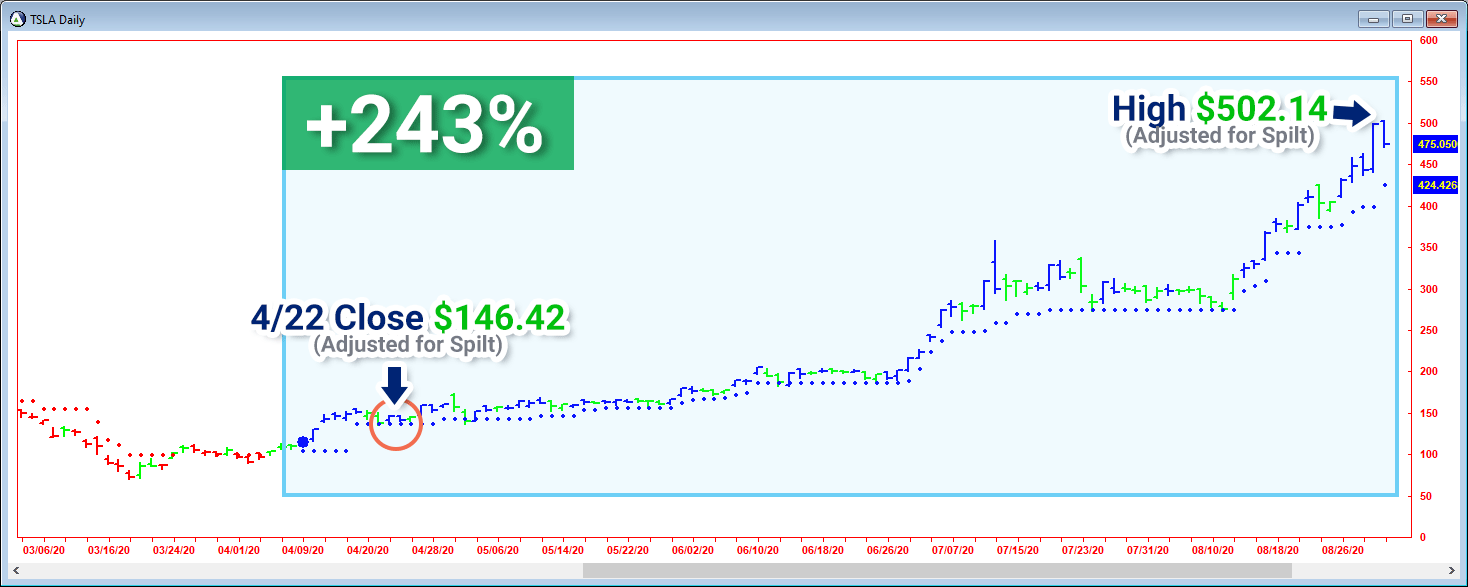
The first Sweet Spot we see is about 2 weeks after the initial buy signal. The price has already gone up over 27%, but a great entry window is signaled here. Prices bounce right off the dots, and there is still a lot of money to be made.
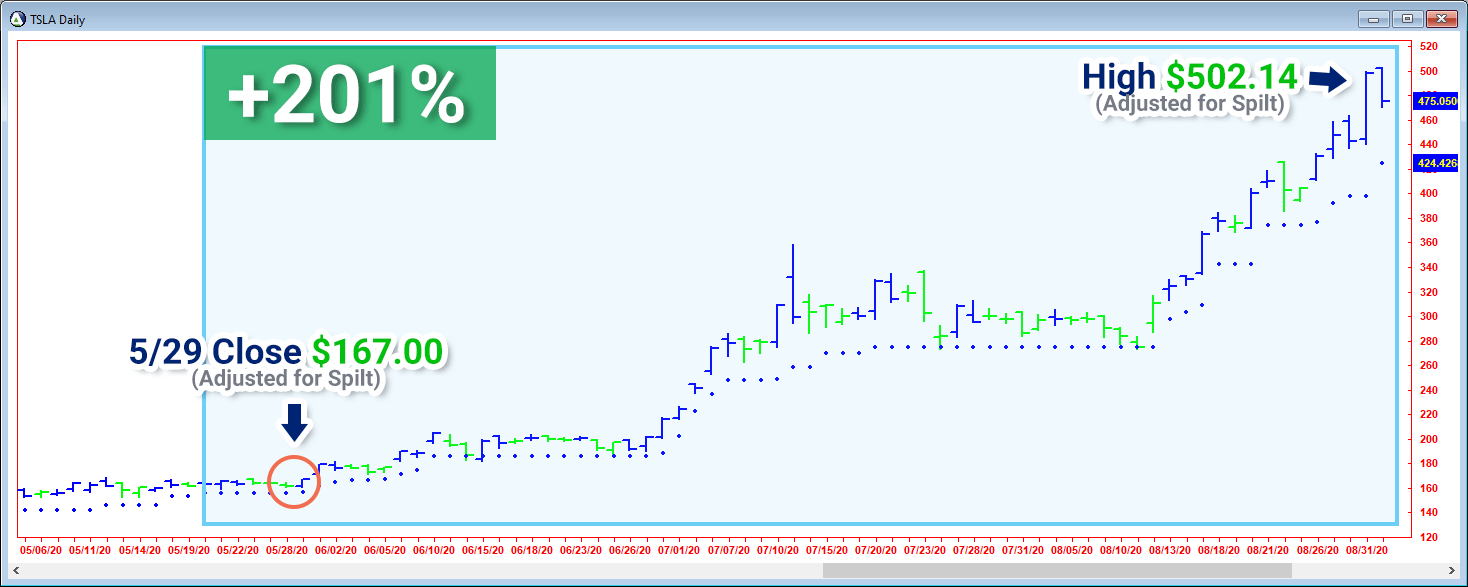
After the Sweet Spot from 4/22, the price has gone up before forming another Sweet Spot on 5/29. Between 4/22 and 5/29, the price was already up over 14%, but there is still over 200% gain left in the move.
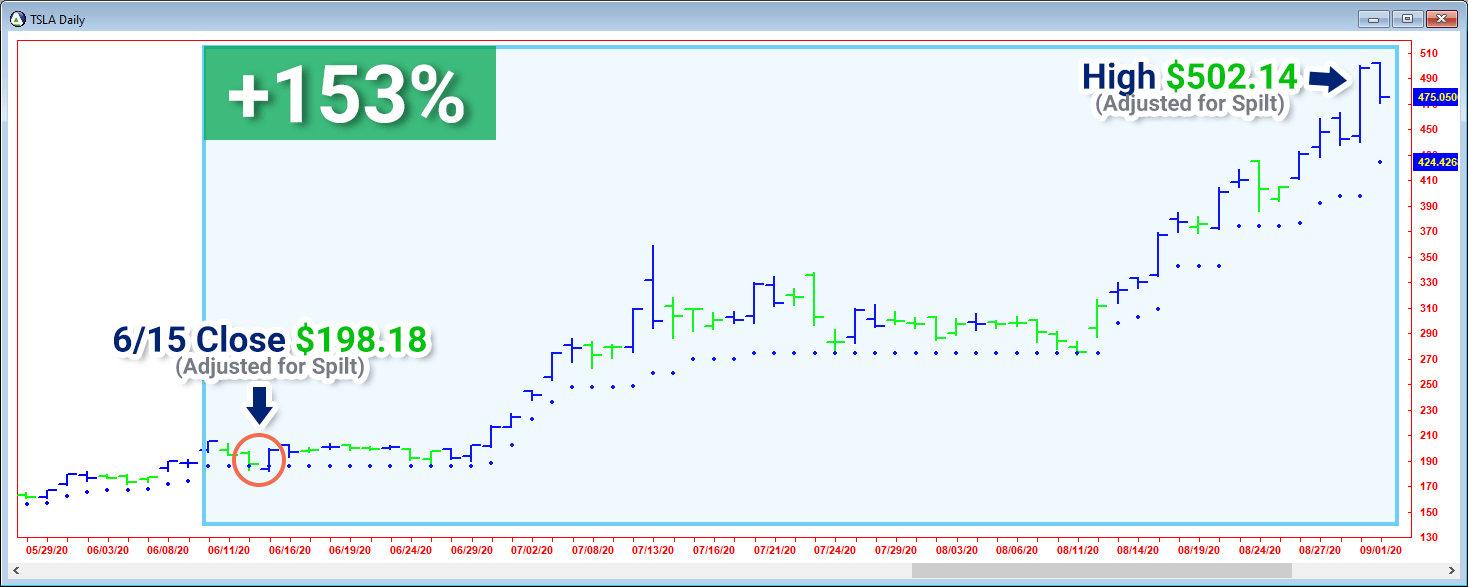
After another 2 weeks, the price is up over 18%, and on 6/15 there is a Sweet Spot at $198.18. Following this Sweet Spot, there is an accelerated move, up over 80% in just under a month!
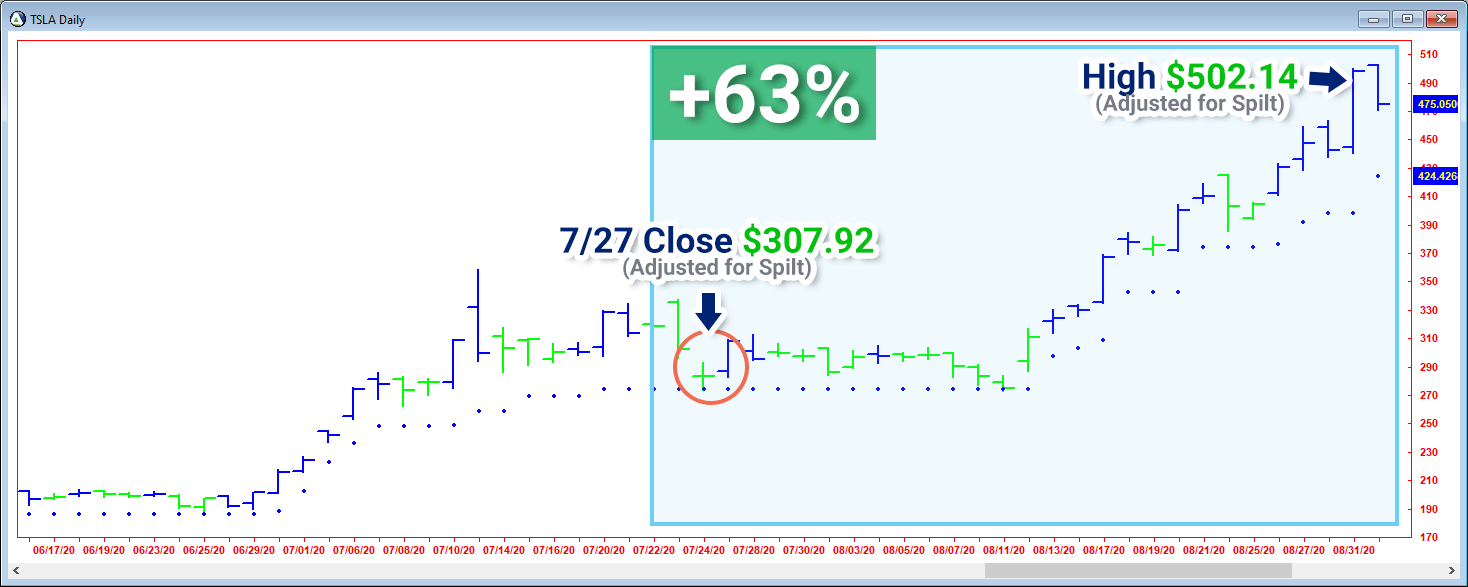
Did you notice the common factor with each of these Sweet Spot setups?
It was that the price came right down to the dots and bounced.
On the positive side, this gave us a great timing window to buy, but that’s not all. The buying opportunity is structured around limiting risk based on the dots.
The dots are the calculation of the Market Support, which should act as a price floor, blocking the price from going lower. If the price breaks through, we would exit, thus limiting risk.
By entering close to the dot, it gives us the combination of rapid gains, and low risk – the Sweet Spot!
Here they are all together, to help visualize...
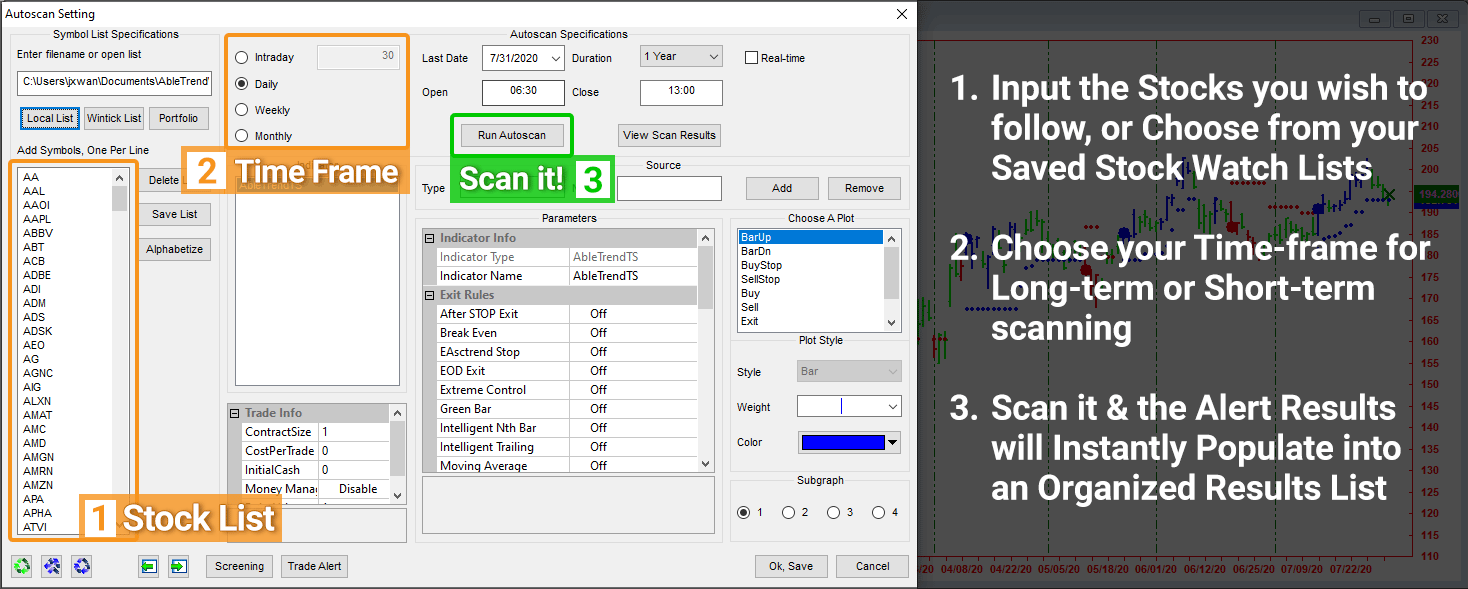
Screener functionality allows you to easily stay on top of a large list of stocks.
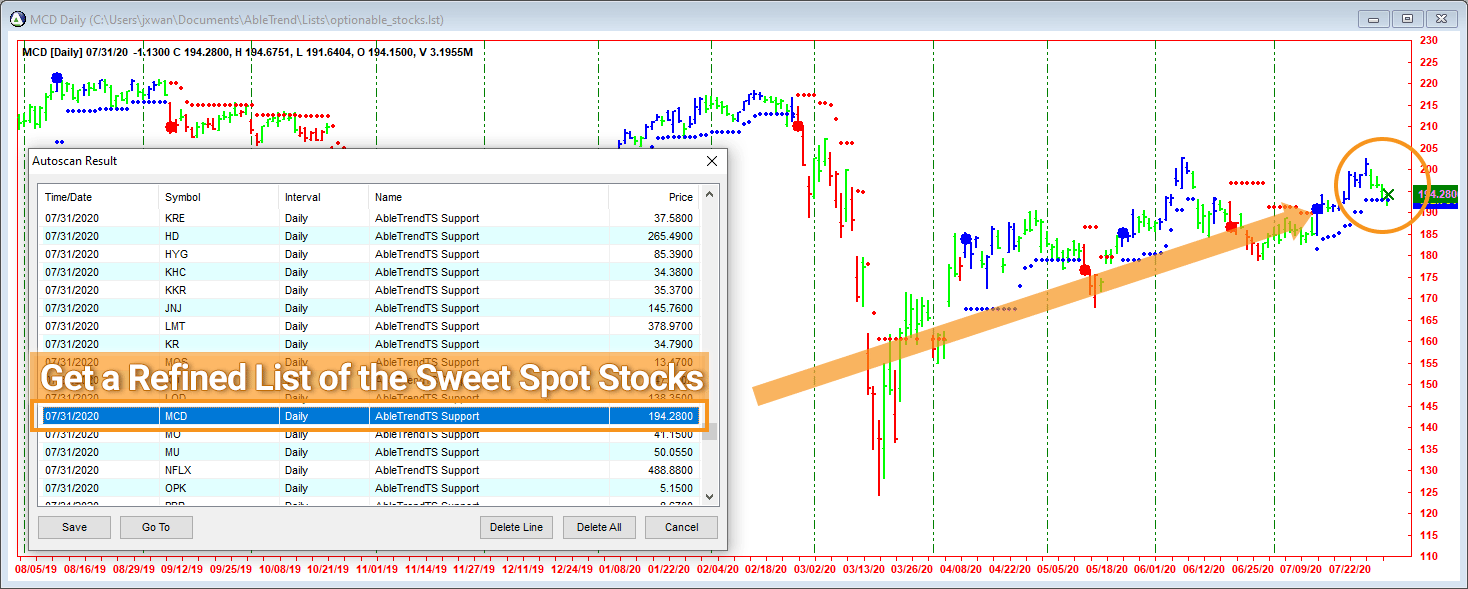
That means, whether you are looking at stocks in a hot sector, stocks with upcoming news or earnings, or even stocks you hadn't considered before, you will be able to tell if they are a good buy & whether the timing is good for buying.
AutoScan is just one part of the whole AbleTrend package.
AbleTrend is an Application for your PC, featuring our Award-winning Trading Signals.
Get the whole package, to try risk-free for 30 days
Get the Software, Signals, and One-on-one Support
Abletrend is supposed to be effective in trending market for a large gain, but it works on choppy sideways market as well, When the market is choppy and in "no trade zone", I watch price action carefully and take profits quickly.. I recommend it to every serious trader who trades for living. The company is also well run by nice people, no annoying sales calls or e-mails.
Terry
I have to say I was immediately impressed by the AbleTrend indicator but of course I was skeptical. I have unsuccessfully tried many different expensive complicated indicators in the past several years. The AbleSys Corp. approach is to let the indicator speak for itself. I tested the indicator for the "1 month trial" and found it to be incredibly accurate & easy to use. I wish I had discovered this tool years ago. AbleSys has weekly webinars which are very helpful, short & to the point with zero sales pressure fluff.
Adam R.
AbleTrend trading software has won
Stocks & Commodities Magazine Readers' Choice Awards
of triple* trading systems for 29 years in a row (1997 - 2025).
*including stock trading systems, futures trading systems & option trading systems
